In-App Help was last updated in 8.6.4 (released 10/23/2019) if you are looking for help with a feature that has been added or enhanced since 8.6.4, please check in Online Help from Help menu.
The Demand Configuration by Location Report
This report allows you to view the configuration data used to calculate target staffing for Demand Manager and Outcomes-Driven Acuity. The report displays configuration data saved as draft or published using the Demand Settings tab of the Configure Location Settings page. Review configuration data annually, at a minimum, to determine if adjustments are required based on profile budget changes.
This report can only be run on profiles and locations that are mapped for Demand Manager and that have Demand Settings configured.
Running the Demand Configuration by Location Report
Complete the following steps to run the Demand Configuration by Location report:
- From the Reports menu, select Demand > Demand Configuration by Location. The Demand Configuration by Location page opens.
- Select one or more facilities. Use CTRL+click to select multiple items. Use SHIFT+click to select a range of items.
- Select one or more profiles.
- Select one or more locations. Demand Manager automatically displays the locations for the selected profiles.
- Enter a Report Date in the box or click the calendar icon to use the date menu.
- Select one or more Report Includes options.
- Selecting Current displays the configuration that is in effect for your selected report date. This option is selected by default.
- Selecting Draft displays configuration data saved as a draft.
- Selecting Future displays configuration data published with a future effective date.
- Select one or more Include Sections options.
- Selecting Summary combines the summary data for all selected profiles and locations into a single table. This option is selected by default.
- Selecting Verification breaks out the verification data for selected profiles and locations.
- Selecting Detail data displays the calculated Demand ratios for all locations and Acuity Settings data for locations that have implemented Outcomes-Driven Acuity.
- Select an Export Type.
- If you select PDF, Demand Manager opens the report results as a PDF.
- If you select Microsoft Office Excel, Demand Manager exports the report results as an Excel spreadsheet. You must have Microsoft Office Excel or Excel Viewer installed on your workstation to use this option.
- Click Run Report. If you selected the PDF export type, the report is displayed in the Report Output pane. If you selected the Excel export type, an alert window opens so you can select whether to open the report or to save the report as an Excel spreadsheet. It is recommended selecting Save so that you can review the report in Excel.
Note: Be aware that report formatting is not retained when you export a report to Excel.
Viewing the Demand Configuration by Location Report
This report is divided into several sections depending on the selection options you selected.
The heading section displays the following items:
- Configuration Type: The type of configuration associated with the report data. For example, a report for the Current configuration has the heading Current Configuration. Demand Manager creates a separate report for each facility and configuration type selected.
- Date: Your selected report date.
The Summary, Verification, and Detail sections may or may not be displayed, based on your selected options. When included, these sections contain the following information.
The Summary Section
The Summary section displays select user-entered data and Demand Manager calculations from the Target and Budget Data sub-tab of the Configure Location Settings page and includes the following information for each facility. Items marked (Optional) display zero (0) values if you selected the Do Not Calculate ADT Data option for the location. The report sorts data automatically by ADT-adjusted HPPD going from the highest value to the lowest.
- Profile Name: Your selected profile.
- Location: Your selected location.
- Direct Care HPPD: The budgeted direct care Hours Per Patient Day (HPPD) entered on the Configure Location Settings page Demand Settings tab for the location.
- Calc HPPD: The HPPD as calculated by Demand Manager. Demand Manager uses the weighted average hours per day for the budgeted Direct Caregiver Staffing Distribution divided by the budgeted census entered on the Configure Location Settings page Demand Settings tab.
- (Optional) ADT Impact: The impact of admissions, discharges, and transfers on the hours per patient day. The formula uses the SUMPRODUCT function, which multiplies groups of numbers together, then adds up the results, as shown in the following formula.
SUMPRODUCT ((Admit time in hours ÷ LOS) * percent of patients admitted) + (Transfer in time in hours ÷ LOS) * percent of patients transferred in + (Discharge time ÷ LOS) * percent of patients discharged + (Transfer out time ÷ LOS) * % of patients transferred out))
- (Optional) ADT adj. HPPD: The ADT-adjusted hours per patient day, which is the Calculated HPPD value minus the ADT Impact value.
- Mid-Level Acuity: The Mid-level Acuity value as entered on the Acuity Settings sub-tab of the Configure Location Settings page for locations using Outcomes-Driven Acuity.
- LOS (Days): The budgeted Length Of Stay (LOS) in days entered on the Configure Location Settings page Demand Settings tab for the location.
- Date: The effective date of the configuration.
- (Optional) Admit %: The percentage of patients who are admitted to this location.
- (Optional) Admit Tot. Min.: The total time needed, in minutes, for all skills to admit a patient to this location.
- (Optional) Trans In %: The percentage of patients who are transferred in to this location from another inpatient location.
- (Optional) Trans In Tot. Min.: The total time needed, in minutes, for all skills to transfer a patient into this location.
- (Optional) Disch %: The percentage of patients who are discharged from this location.
- (Optional) Disch Tot. Min.: The total time needed, in minutes, for all skills to discharge a patient from this location.
- (Optional) Trans Out %: The percentage of patients who are transferred out from this location.
- (Optional) Trans Out Tot. Min: The total time needed, in minutes, for all skills to transfer a patient out of this location.
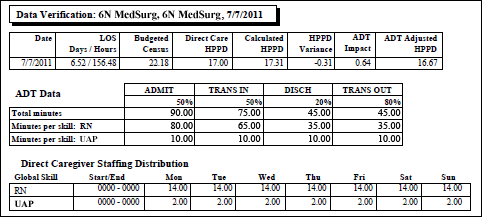
The Verification Section
When you select to include the Verification section, the report displays all user-entered data and Demand Manager calculations. This information comes from the Target and Budget Data sub-tab of the Configure Location Settings page and includes the following information for each profile and location. Items marked (Optional) display zero (0) values if you selected the Do Not Calculate ADT Data option for the location.
- Date: The effective date of the configuration.
- LOS Days/Hours: The budgeted length of stay in days and hours entered on the Demand Settings tab of the Configure Location Settings page.
- Budgeted Census: The budgeted census entered on the Demand Settings tab.
- Direct Care HPPD: The budgeted direct care Hours Per Patient Day (HPPD) entered on the Demand Settings tab.
- Calculated HPPD: The HPPD as calculated by Demand Manager. Demand Manager uses the weighted average hours per day for the budgeted Direct Caregiver Staffing Distribution divided by the budgeted census entered on the Configure Location Settings page Demand Settings tab.
- HPPD Variance: The difference between the Direct Care HPPD and the Calculated HPPD.
- (Optional) ADT Impact: The impact of admissions, discharges, and transfers on the hours per patient day. The formula uses the SUMPRODUCT function, which multiplies groups of numbers together, then adds up the results, as shown in the following formula.
SUMPRODUCT ((Admit time in hours ÷ LOS) * percent of patients admitted) + (Transfer in time in hours ÷ LOS) * percent of patients transferred in + (Discharge time ÷ LOS) * percent of patients discharged + (Transfer out time ÷ LOS) * % of patients transferred out))
- (Optional) ADT adj. HPPD: The ADT-adjusted hours per patient day, which is the Calculated HPPD value minus the ADT Impact value.
- (Optional) ADT Data table: This optional table displays the information entered by you in the ADT Events table on the Demand Settings tab.
- Admit %: The percentage of patients who are admitted to this location
- Admit Total Minutes.: The total time needed, in minutes, for all skills to admit a patient to this location
- Admit minutes per skill: The time needed, in minutes, by skill for the admission event
- Trans In %: The percentage of patients who are transferred in from another inpatient location
- Trans In Total Minutes: The total time needed, in minutes, for all skills to transfer a patient into this location
- Transfer In minutes per skill: The time needed, in minutes, by skill for the transfer in event
- Disch %: The percentage of patients who are discharged from this location
- Discharge Total Minutes: The total time, in minutes, needed for all skills to discharge a patient from this location
- Discharge minutes per skill: The time needed, in minutes, by skill for the discharge event
- Trans Out %: The percentage of patients who are transferred out from this location
- Trans Out Total Minutes: The total time needed, in minutes, for all skills to transfer a patient out of this location
- Trans Out minutes per skill: The time needed, in minutes, by skill for the transfer out event
- Direct Caregiver Staffing Distribution table: This table displays the information entered by you in the Direct Caregiver Staffing Distribution table on the Demand Settings tab.
- Global Skill: The Global Skill for the direct caregiver.
- Start/End: The start and end time for the data entered for each global skill.
- Days of the Week: These columns show the number of caregivers by skill, start time, and end time for each day of the week.
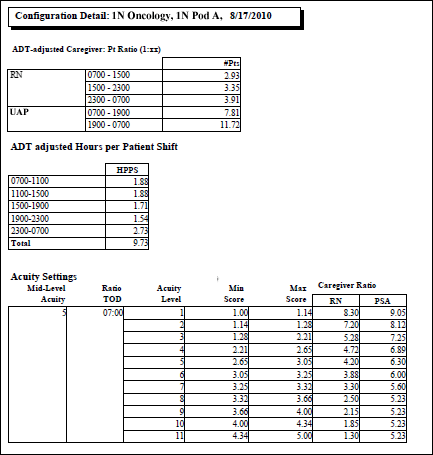
The Detail Section
When you include the Detail section, the report displays the calculated ADT-adjusted Caregiver to Patient ratios for global skills by time of day and the ADT-adjusted Hours Per Patient Shift (HPPS). The Caregiver to Patient ratios for global skills by time of day come from the Direct Caregiver Staffing Distribution table on the Demand Settings tab. These ratios are used to calculate the target staffing for locations that have implemented Demand Manager only.
- ADT-adjusted Caregiver: Patient Ratio (1:xx)
- Global Skill: The global skill of the direct caregiver.
- Start/End: The times of the caregiver:patient ratio for the skill
- # Pts: The number of patients for each caregiver by skill, which Demand Manager calculates as the Budgeted Census divided by the ADT-adjusted weighted average of caregivers from the Direct Caregiver Staffing Distribution table.
- ADT-adjusted Hours per Patient Shift (HPPS)
- Start/End: Shift category partitions for the location starting with the anchor partition of the default shift category.
- HPPS: The hours per patient shift for all skills for the shift category partition, calculated as the number of ADT-adjusted weighted average caregivers multiplied by the duration in hours of the shift category partition. Then the values for each shift category are divided by the budgeted census.
Organizations that have implemented Demand Manager and Outcomes-Driven Acuity also see the Acuity Settings configured for the location. The ratios shown on Acuity Settings are used to calculate the target staffing for locations that have implemented Outcomes-Driven Acuity.
- Acuity Settings
- Mid-Level Acuity: The mid-level acuity for the location for this configuration.
- Ratio TOD: The time of day associated with the caregiver:patient ratios entered on the Acuity Settings tab of the Configure Location Settings page.
- Acuity Level: The number of acuity levels configured for the location.
- Min Score: The minimum acuity assessment raw score for each acuity level; the raw score of the assessment must be equal to or greater than the minimum score to be assigned the acuity level.
- Max Score: The maximum acuity assessment raw score for each acuity level; the raw score of the assessment must be less than the maximum score to be assigned the acuity level.
- Caregiver Ratio by Global Skill: The number of patients by skill for each acuity level for the ratio time of day.
Sample Report
In this example, a user ran the report for two profiles of the Hometown Medical Center (HMC) facility: 5W MedSurg and 6N MedSurg. The 5W MedSurg profile has two defined locations, Pod A and Pod B.
The report includes the Summary data for the Current configuration.

The Verification section is broken out for each profile and location. The following illustration displays the information for 6N MedSurg.
The Detail section includes the Acuity Settings for locations that have implemented Outcomes-Driven Acuity. The following illustration displays the detail and acuity information for the Pod A location of the 1N Oncology profile.
 Related Topics