In-App Help was last updated in 8.6.4 (released 10/23/2019) if you are looking for help with a feature that has been added or enhanced since 8.6.4, please check in Online Help from Help menu.
The Housewide Staffing for Demand and Outcomes-Driven Acuity Report
The Housewide Staffing for Demand and Outcomes-Driven Acuity Report displays, by profile and global skill, the target staffing based on patient demand, actual and projected patient events, employee hours or FTEs scheduled, and variances. The list of employees scheduled, their skill, start time, and total hours worked also display. Clairvia Web saves the options you select for each report by your user login once you click Run Report.
The source of the target staffing hours the report uses in its calculations depends on the reporting period you select.
- Past to Present: For dates in the past and for the present (with present meaning the time you run the report) the report uses actual patient demand and actual patient events to calculate the Target Staffing value.
- Present to Near Future: For time ranges from the present up to 36 hours in the future, the Target Staffing value includes:
- Current demand workload values adjusted for time of day and acuity levels (when implemented).
- Projected departure and discharge event workload, calculated by using the pattern end date as originally assigned or by using updated dates and times entered on the Administer Patient Pattern window (or updated through an alternate source solution) for each patient.
- Workload associated with actual and projected Other patient events.
- Target Staffing for non-direct care staff global skills, such as managers and clerical staff, is pulled from the workload matrix, which is stored in Workload Planner. This approach produces an accurate staffing projection for the next 36 hours based on current patients, acuity, and expected departures. From a process perspective, the only data missing is the calculated impact of expected admissions and transfers in. When Demand Manager auto-pushes patterns forward, the projected dates on the Administer Patient Pattern window do not change and departure workload is not calculated. When running reports for past dates, the targets include workload for actual ADT events; the target only includes workload for events that actually occurred.
- Future: If the report is run for a period that starts more than 36 hours from now, the Target is calculated using the 6-week historical average by day of week and time of day and includes workload associated with actual demand, including actual ADT events. The effect of other events is not included in the historical average.
See How Demand Manager Calculates Staffing Levels for more information on how target staffing hours are calculated.
Profiles must contain employees and have a defined anchor partition in order for the Profiles menu to display them.
If you are using a filter when viewing the report, the filter name is displayed in the Filter menu.
Running the Housewide Staffing for Demand and Outcomes-Driven Acuity Report
Complete the following steps to run the Housewide Staffing for Demand and Outcomes-Driven Acuity report:
-
Open Clairvia Web.
- From the Reports menu, select Schedule > Housewide Staffing for Demand and Outcomes-Driven Acuity Report. The selection criteria page opens.
- Select one or more Profiles. Select multiple profiles by holding down the CTRL key while clicking on the profile names. Which profiles are displayed depends on your security permissions.
- Select a Profile Order. Set the order in which the profiles print by clicking the profile to be moved and using the up and down arrow buttons to the right of the Profile Order table to move the highlighted profile within the list.
- Select a Shift Category. The report uses only one shift category from the menu of selected profiles; this parameter enables you to pick that shift category.
- Select one or more Shift Category Partitions with Spillover. You cannot run this report for more than 12 Shift Category Partitions. If you need a report for 12 or more Shift Category Partitions, run the Daily Staffing Board report instead.
- Select one or more Skills.
- Select to Report By Hours or FTEs.
- Enter a Date in the box or click the calendar icon to use the date menu. The default value for this box is either today's date (the first time you run this report) or the last date used (if you have run this report before).
- Select to Display Employee's Name or Abbreviation.
- Select a Suppress Coverage Tables option:
- If you select Yes, the coverage table containing the counts by skill does not display. The census (or other workload value) and staffing ratios (if selected) do display.
- If you select No, the Coverage Tables display.
- Select a Suppress Staffing List option:
- If you select Yes, the report displays the coverage tables but not the list of staff members.
- If you select No, the Staffing List is displayed.
- Enter the number of Write-in Lines. These lines display at the bottom of the report when it is printed. They can be used for note-taking, recording data, or any other purpose. If you do not want any lines, enter 0 (zero).
- Select a Show Utilization option:
- If you select Yes, the report displays percent utilization.
- If you select No, the report does not include utilization. Percent utilization equals Target Hours or FTEs divided by Actual/Scheduled Hours or FTEs. Note that if you chose to Suppress Coverage Tables in step 11, utilization information cannot display regardless of your selection in this step.
- Select an Include Staffing Ratios option:
- If you select Yes, the report includes the target nurse-to-patient ratio for each profile, as that target has been entered in the budget data.
- If you select No, the staffing ratios are not included.
- Select an Include Employee FTE option:
- If you select Yes, the report includes each employee’s FTE on a second row under the start time and hours.
- If you select No, employee FTEs are not included.
- Select an Include Assignment Notes option:
- If you select Yes, the report includes any assignment note entered for a scheduled task or shift on a second row, below the employee name and abbreviation. The note wraps to a third line if needed. The assignment notes in this report are those linked to specific assignments and tasks on specific dates as created in the Staff Manager Client Schedule Editor.
- If you select No, assignment notes are not included.
- Select an Include UDF option:
- If you select Yes, the report includes any user-defined fields (UDFs) associated with staffing reports (as set in the client_rules table). You should contact Cerner Corporation Support if you need assistance configuring Staff Manager to pull the staffing UDF. When Employee FTE is included, the staff list requires two rows to display each employee’s information, making the staff list longer. When UDF or Assignment Notes or both are selected for inclusion, the staff list prints two rows only for employees who have a UDF associated with staffing reports or an assignment note for the task or shift scheduled on the date selected.
- If you select No, UDFs are not included.
- Select an Include Profile Note option:
- If you select Yes, the report includes any profile note that has been entered in Staff Manager Administrator.
- If you select No, profile notes are not included.
- Select an Include Employee Scheduled Paid Hours option:
- If you select Yes, the report displays employees' paid hours for the pay period.
- If you select No, scheduled paid hours are not included.
- Select a Suppress Non-Skill Based Tasks in Actual option:
- If you select Yes, any task not associated with a skill is not included in either the Coverage or the Total Coverage tables, and the hours for that task is not included in the totals.
- If you select No, non-skill based tasks are included in the Coverage or Total Coverage tables. This option only applies if Suppress Coverage Tables or Include Total Coverage Table or both are set to Yes.
- Select an Include Total Coverage Table option:
- If you select Yes, the report includes the coverage table with totals by profile skill for each selected shift category partition.
- If you select No, the table is not included.
- Select to print Columns by Profile or Partition by clicking the corresponding button.
- Enter the Number of Columns/Paper Size. To minimize wrapping of text, the maximum number of columns is limited to 4. If this box is left blank, Clairvia Web will prompt you to enter a value. The number of columns selected with this parameter will also determine the report's default paper size. For one and two columns, the report will print to letter paper in portrait format (8½ inches wide X 11 inches high). For three columns, the report will print to letter paper in landscape format (11 inches wide X 8½ inches high). For four columns, the report will print to legal paper in landscape format (14 inches wide X 8 ½ inches high). The default settings may be affected by your Adobe Reader print options.
- Select a Page Break at X option. The exact phrase displayed for this parameter depends on whether you selected to print columns by Profile or Partition in step 23.
- When you select Columns by Profile, this parameter reads Page Break at New Partition. Selecting Yes forces a page break prior to printing the profiles for the next shift category partition. When you configure the report to run with Columns by Profile for multiple shift category partitions, selecting Yes forces a page break prior to printing the profiles for the next shift category partition. The report ignores this setting when you select Columns by Partition.
- When you select Columns by Partition, this parameter reads Page Break at New Profile. Selecting Yes forces a page break prior to printing the shift category partitions for the next profile.
- Select Start New Row(s) With. When you configure the report with Columns by Profile in step 23, this parameter lets you select the profile or profiles that should print in the first column of a new row. The report assumes that the first profile begins on the first row, so it is not necessary to highlight the first profile in the list.
- Select Start New Page With. This option works with Start New Row(s) With. When you select multiple profiles in the Start New Row(s) With menu, this option lets you put one or more of those profiles on a new page.
- Select Print in Partition Order (Yes or No). This option lets you print the Housewide Staffing Report for multiple partitions in succession.
- If you select Yes, you can select the First Shift Category Partition (step 29).
- If you select No, the report displays the partitions starting with the first anchor partition of the profile you placed first in step 4.
- Select a First Shift Category Partition. This is the first shift category partition that the report should begin with for your selected date. This option is unavailable if you selected Columns by Partition in step 23 or selected No in step 28.
- Enter the Number of Shift Category Partitions to Print. This is the number of shift category partitions to print, starting with the first shift category partition indicated in step 29 and going forward from there. The limit for this option is 12.
- Select a Shade Staff List by Skill option:
- If you select Yes, the staff list alternates with gray and white shading by profile skill.
- If you select No, the staff list does not contain shading.
- Select a Staff List Format option. The Staff List displays employee names or abbreviations, skills, task abbreviations, and float from profiles.
- Selecting Truncated limits the employee name or abbreviation to what fits in the column. The amount that fits varies based on the characters and whether the text is in upper or lower case. To increase the number of characters that can be displayed, the report does not include a space between the employee last and first names.
- Selecting Wrapped wraps the text in the employee name or abbreviation using as many rows as needed to display all the information.
- Select a Display Float from Profile option. Click Name to display the float from profile name; click Abbrev to display the profile's abbreviation. The Float from Profile parameter displays the float employee's primary home profile.
- Enter a numeric value for the Truncate Float Profile at Character box. This option lets you select the number of characters displayed for the float profile. For example, if you enter 7, seven characters of the float profile will display. The number of characters that fit on a single row varies from six to nine, depending on whether the characters are spaces, lower or upper case letters, the number of consecutive characters, and so on. It is recommended that you start by setting this value to seven (for a single row) or 14 (for two rows), and then adjust the number of characters as desired.
- Click Run Report.
For information on printing this report, see Printing Reports.
Viewing the Housewide Staffing for Demand and Outcomes-Driven Acuity Report
This report, sorted by profile and shift category partition, then by skill and employee's last name, contains the following information.
- Title: Housewide Staffing for Demand and Outcomes-Driven Acuity Report.
- Headings: Day of Week, Date, Profile Name, Shift Category Partition, in hours or in FTEs, depending on your selections.
- [Volume]: There are several important points you need to know about this column:
- Staff Manager uses the value in the profile's Workload Measurement Label box as the column heading. If the label box is blank, Staff Manager will use the default value of Volume.
- The data used in this column comes from the automatic interface with your organization's Registration application that retrieves census data.
- The volume value for the selected profile and shift category partition depends on when you run the report (report run time) and the time the report reviews (the report period).
- Past report period: If the report period is before or equal to the report run time, the volume value is the volume at the shift category partition's start time.
- Now + 36 hours: The volume value for the current shift is the volume at the current shift category partition's start time. The volume for shifts that start in the next 36 hours are adjusted for projected discharges calculated by using the pattern end date as originally assigned or by using updated dates and times entered on the Administer Patient Pattern window (or updated through an alternate source solution) for each patient.
- Future report period: If the report run time is more than 36 hours from now, the report calculates volume value using the retrospective 6-week average at the shift category partition's start time by day of week. For example, if you run a report on Monday, September 5, for a 7a-3p shift on Thursday, September 8, Staff Manager will calculate the volume by averaging the volume values for the previous 8 Thursdays at 7:00 a.m.
- Event Summary Row: This row displays actual ADT activity, projected departures, and projected discharges and Other patient events, if any.
- The format for ADT events is A:# D:# TI:# TO:# pd:# pD:#, where A is Arrival, D is Discharge, TI is Transfer In, TO: is Transfer Out, pd is projected Departures and pD is projected Discharges, each followed by the number of events during the selected period. If there have been no ADT events or if there are no projected events, the letter code is followed by 0.
Note: If your organization supports transfers across facilities, you should be aware that transfers in from a preliminary unit in another facility are counted under A (Arrival), transfers in from inpatient units are counted under TI, and all transfers out are counted under TO. See Understanding Patient Transfers Across Facilities for more information.
- Other events are shown in the format E: Caregiver:Pt Ratio, Skill, Time Period. For example, E: 1:1 UAP 0800-1000 means there was an Other patient event from 8:00 a.m. to 10:00 a.m. that required 1:1 patient care from a caregiver with the Unlicensed Assistive Personnel (UAP) skill. If there were multiple Other events during the shift, events are listed separated by a semi-colon (;). The ADT data displayed in the coverage table are dynamic. For example, if you run the report at 6:00 a.m. for 7a-3p shift staffing, the census might be 30, with ADT statistics of A: D: Tin: Tout: (there is no ADT information since the shift has not started yet). If you run the report again at 11:00 a.m. during the 7a-3p shift, the report displays the census as of 7:00 a.m. and it will display any ADT events that occurred between 7:00 a.m. and 11:00 a.m. The target staffing can vary widely through the shift.
- Average Acuity (Av Ac): If your organization has the optional Outcomes-Driven Acuity application, the report lists the average acuity value for the profile in that shift category partition based on the reporting period:
- Past to present: For dates in the past and for the present (with present meaning the time you run the report) the report uses the average patient acuity for the shift partition.
- Present to near future: For time ranges from the present up to 36 hours in the future, the average acuity value includes:
- Current acuity levels
- The mid-level acuity score when adjusting the target value using the 6-week historical average to account for the unknown impact of projected arrivals.
- Future: The report calculates the average acuity for date ranges more than 36 hours in the future all future reporting periods using the retrospective 6-week average acuity at the shift category partition's start time by day of week.
- Staffing Ratios: If you selected to show staffing ratios, the report displays the Target Ratio (from Budget Data) and the Actual Ratio, calculated from census and number of coverage FTEs. To calculate the Staffing Ratio, Staff Manager divides the number of patients by the number of employees working in the shift category partition. The number of employees is calculated by taking the total employee hours for a skill during the shift category partition and dividing by the FTE conversion factor (converted to hours) or the length of the shift category partition in hours, whichever is less.
- Utilization: If you selected to show utilization, this column displays the percent utilization by global skill and total utilization. Staff Manager calculates utilization as Target Hours (or FTEs) divided by Actual (Scheduled) Hours or FTEs.
- The Coverage Table reports in hours or FTEs depending on selection on the parameter page. It includes the following information:
- The Notes section is designed for hand-written notes.
See How Demand Manager Calculates Staffing Levels for information on how target hours and FTEs are calculated.
If not suppressed, the Staff List includes the following information:
- The Skill of each employee scheduled on your selected date for the profile and shift category partition
- The Employee Name or Abbreviation of each employee scheduled on your selected date for the profile and shift category partition; if the employee is scheduled for a shift opportunity, an (O) are displayed before the employee's name
- The Task Abbreviation for each employee on your selected date for the profile and shift category partition
- The Start Time of the task that each employee is working in the profile and shift category partition, as defined in Staff Manager Client
- Hours/FTEs: Lists the number of hours or coverage FTEs that each employee is working in the profile and shift category partition.
- Float From Profile: Displayed if the employee has another profile as their primary home profile.
- Optional on second row per employee: Staffing UDF, Paid Hours, and Employee FTE. If paid hours are included, the value will print in bold red type if the employee has overtime hours, blue underlined type if paid hours are less than the paid hour equivalent of that employee's FTE, or in black normal type if the paid hours are equal to the employee's FTE. Staff Manager calculates overtime hours based on the pay period and overtime settings for both the employee and the profile.
If included, the Total Coverage Table includes the following totals by global skill, day, and partition:
- Global Skill
- Target: If the Total Target is affected by Other patient events, the value is preceded by the letter E, such as E21.75. If the Target is affected by staffing minimums, the column includes a lowercase m, such as m8.00. If the Total Target is affected both by Other patient events and staffing minimums, the column includes the letters mE, such as mE12.75.
- Actual/Sched
- Clinical Adjustment
- Adjusted Variance
- Utilization
Notes on Sorting
The application sorts the information in the Housewide Staffing for Demand and Outcomes-Driven Acuity Report in the following order:
- Profile
- Skill (in Skill Display order): The report lists profile skills not mapped to global skills as NoMap (an abbreviation for Not Mapped).
- Start Time (that is, Employee Scheduled Coverage Start Time)
- Task Abbreviation
- Employee Last Name or Abbrev, depending on what you selected to display in the report.
This groups employees together by the time their shift started, then lists all employees scheduled for the same task. Float-in employee names are not treated differently and are sorted within these same specifications.
Sample Report
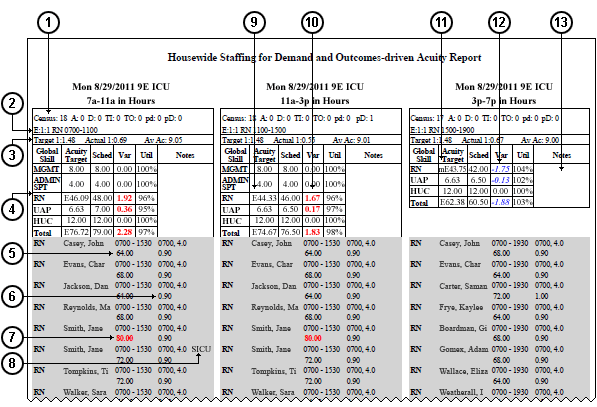
- Census, ADT, and Projected Departure and Discharge information
- Event Data
- Staffing Ratios and Average Acuity
- Totals by Skill
- Paid Hours
- FTE
- Bold red type indicates overtime hours.
- Float from profile
- E indicates a target affected by Other patient events.
- Positive variances (overstaffing) display in red bold text.
- mE indicates a target affected by staffing minimums and Other patient events.
- Negative variances (understaffing) display in blue italic text.
- Blank space for handwritten notes
 Related Topics